What $122 Million in Pre-FOMC Flow Is Trying to Tell You
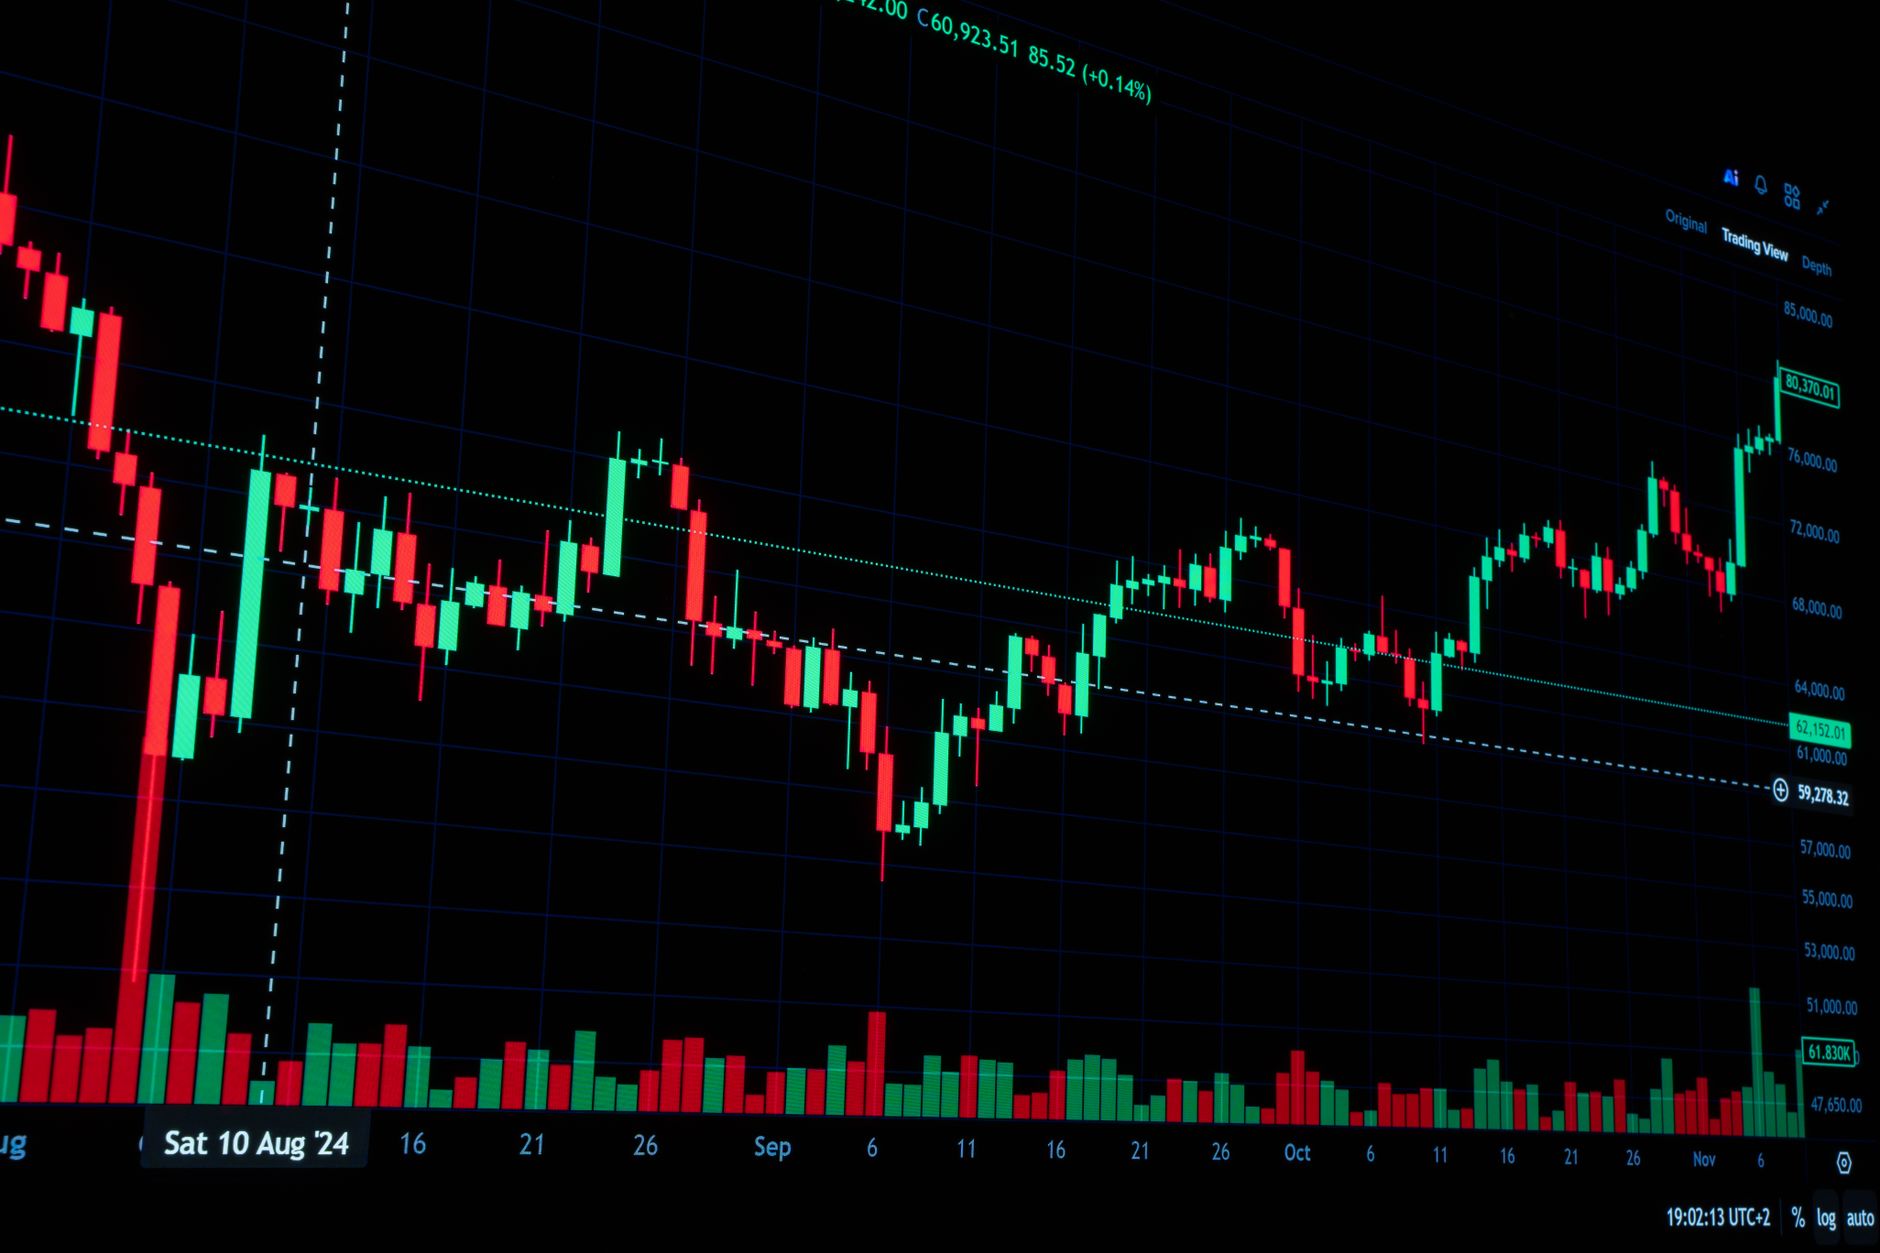
A trader moved $122M before the Fed's rate hike. Learn what pre-FOMC unusual options flow really signals and why chasing it burns retail traders.
The Fed hiked rates today. Markets whipsawed. And somewhere in the noise, a single trader moved $122 million ahead of the 2 p.m. announcement — a print so large it landed on every scanner simultaneously and is still generating more Reddit threads than the rate decision itself. This is what unusual options flow before FOMC looks like when it breaks through to the surface. It is messy, ambiguous, and, if you are not careful, genuinely dangerous to follow.
What Unusual Options Flow Before FOMC Actually Looks Like
On an ordinary trading day, the options tape hums at a predictable volume. Then a catalyst day arrives — a Fed decision, a CPI print, a major earnings release — and the texture of the flow changes. Larger blocks start hitting. Contracts sweep across multiple strikes in quick succession. Open interest appears in lines that did not exist at yesterday's close. These are the fingerprints of someone who has a view worth sizing into, or a risk exposure worth hedging against.
The $122 million print reportedly hit well before the Fed's decision window opened. Whether it was a directional bet, a duration hedge on a fixed-income book, or a multi-leg structure the public tape only partially captures, its scale made it visible. Most institutional flow is designed to be invisible — routed through dark pools, fragmented across brokers, built specifically to avoid moving the market. When something this large surfaces on public tape, there are really only a few explanations: the trade was too large even for dark pool absorption, the routing left a footprint, or the visibility was intentional. All three happen, and they do not carry the same meaning.
What makes the flow "unusual" is not just the size. It is the timing. Pre-FOMC implied volatility is elevated across the board. Options are expensive. Anyone paying that premium on the eve of a decision is paying a significant cost for the right to be right.
How Dark Pool Trades Show Up Before Fed Decisions
Dark pools exist to give large participants a way to execute without telegraphing their intent to the rest of the market. When a print this large bypasses that anonymity and shows up on public tape, you are almost certainly seeing only part of a much larger structure.
In the days leading up to a Fed meeting, economic data — low jobless claims, labor market resilience, the kind of signals that sharpen rate expectations — shapes where smart money begins to lean. That positioning shows up gradually: unusual sweeps in near-term expiries, out-of-the-money strikes trading at multiples of their daily average, a single enormous block that triggers every flow alert in the room. The visible print is the evidence, not the full argument.
The critical thing to hold in your mind: a dark pool print does not tell you what the trade means. A $122 million position could be long calls betting on a dovish pivot, long puts hedging a massive equity book against a hawkish shock, or a complex spread with legs you simply cannot see from the public data. The piece of the trade that surfaces is almost never the whole story, and treating it as such is where retail traders get into trouble.
Should Retail Traders Follow Institutional Options Flow?
Here is where the crowd psychology becomes genuinely interesting, and genuinely risky.
When a trade this size surfaces, it becomes a Rorschach test almost immediately. Bullish traders see smart money loading up ahead of a dovish surprise. Bearish traders see a hedge being put on against a policy shock. Both groups share the same screenshot and arrive at opposite conclusions. This is how FOMO gets engineered — not necessarily by the original trader, but by the narrative that grows around a single visible print.
The asymmetry between institutional and retail risk is worth sitting with for a moment. A firm that moves $122 million into a pre-FOMC options position has, in all likelihood, already hedged that position several different ways. Their downside is managed. Their cost basis was negotiated at better rates than you will ever see. Their prime broker probably gave them favorable execution. When you buy the same strike after seeing the screenshot on a forum, you are buying at a different price, with different risk, with no hedge, on a catalyst that is now hours from resolution.
The 2018 rate hike cycle taught a generation of traders that the trade everyone was talking about — the obvious, consensus play — was often the one that got punished most severely. Markets have a way of inflicting maximum damage on maximum agreement.
Following flow is a skill. Chasing flow is a reflex. The difference between them is entirely in the process.
How to Tell If a Big Options Trade Is Informed or a Hedge
The honest answer: you usually cannot, with certainty. But there are structural signals that point in one direction or the other.
Informed directional trades tend to concentrate at specific strikes — near-term, at-the-money or modestly out-of-the-money, in contracts expiring close to the catalyst date. They are concentrated bets on a move within a narrow window. Hedges look different: further out in time, spread across multiple strikes, sometimes working in both directions at once. They are designed to offset existing risk rather than to express new conviction.
The $122 million print, based on what has been reported, does not fit either profile cleanly. Complex, large, pre-catalyst trades are far more often institutional risk management than someone with inside knowledge loading up for a quick flip. The Fed's decision process, whatever you think of the institution, does not leak at scale. The more likely explanation for a trade this large, this early, is a major firm managing duration exposure in a rising-rate environment — exactly the kind of activity that would accelerate as inflation concerns resurface and energy prices push higher.
Flow scanners, real-time alert tools, and the kind of AI-connected charts that surface unusual activity as it develops can help you see these prints faster than you could manually. But speed does not give you an edge by itself. Context does.
Sizing the Lesson, Not the Trade
The most useful thing you can take from today's $122 million print has nothing to do with the specific position. It is this: unusual options flow before FOMC is information, not instruction. It tells you that someone, somewhere, has a view significant enough to pay a great deal of money for. It tells you nothing about whether that view is correct, how it is hedged, or whether it has any relevance to your own portfolio.
The traders who get hurt on days like today are rarely the ones who missed the $122 million trade. They are the ones who heard about it at 1:45 p.m., bought calls at the ask, and watched the market do exactly what it does on Fed days: move violently in both directions before it decides where it actually wants to go.
The discipline is not in finding the signal. It is in knowing when the signal is not yours to act on.