ARM Holdings Stock 2026: The Toll Booth on AI Chips
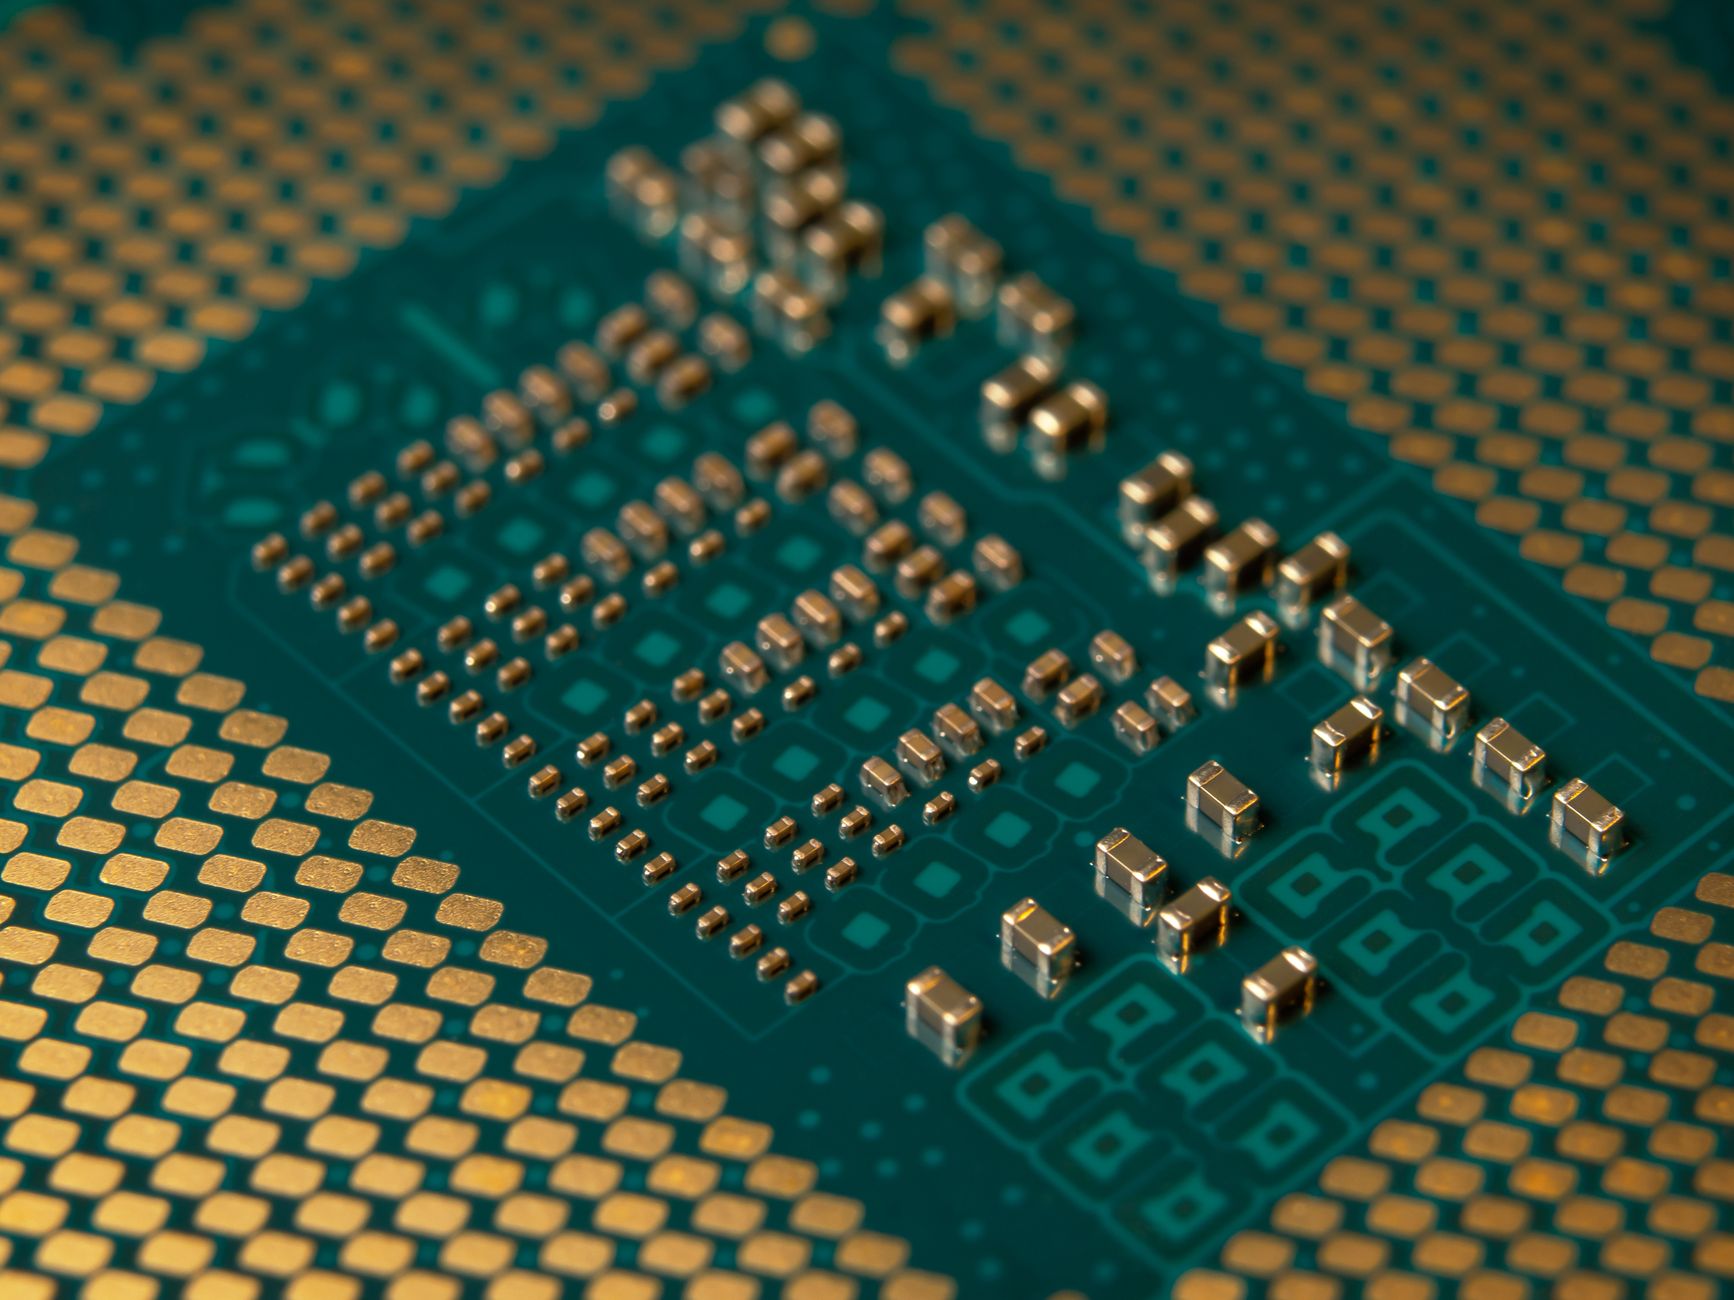
ARM earns a royalty on every AI chip shipped — Nvidia's, Apple's, Qualcomm's. Why ARM Holdings stock 2026 is worth watching and how to trade it.
ARM Holdings stock 2026 is up 4.0% on the session to 275.60, on 7.0 million shares — nearly double the 20-day average of 3.9 million. That is not noise. When a stock trades 1.8x normal volume through a key moving average cluster, buyers are not nibbling. They are establishing.
The question doing the rounds on trading desks today: is ARM a hidden winner of the AI chip race? Short answer is yes. The longer answer explains why most retail traders are watching the wrong names.
How Does ARM Make Money From AI Chips Without Making Chips?
ARM doesn't fabricate anything. No wafers, no fabs, no inventory risk. What it owns are instruction set architectures — the fundamental blueprints that tell a processor how to execute code. Every chip designer that builds on those blueprints pays ARM a licensing fee upfront, then a per-unit royalty on every chip shipped. That is the semiconductor royalty business model, and it is extraordinarily capital-light.
Nvidia's Blackwell GPU runs on ARM-based CPU cores. Apple's M-series and A-series chips are ARM architecture. Qualcomm's Snapdragon. Amazon's Graviton. Google's Axion. Microsoft's Cobalt. The hyperscalers building custom silicon to run AI inference workloads are all ARM licensees. The fab guys spend billions on equipment and real estate. TSMC's August revenue record confirms the AI capex signal. ARM collects a toll on the output. Different businesses entirely.
The royalty rate per chip is not fixed. Each new ARM architecture generation — v8, v9, now trending toward v10 — carries a higher royalty rate. ARM has been deliberately pushing customers toward v9, which commands meaningfully higher per-chip economics than the v8 generation that powered the last decade of mobile. As the installed base migrates, average royalty rates structurally rise even with no volume growth. Volume is growing anyway. That is the ARM chip royalty model in its cleanest form: price per chip goes up, units go up, margins expand, capex stays flat.
Why ARM Benefits More as AI Moves to the Edge
This is the structural trade. Cloud AI inference runs on big GPU clusters — Nvidia's domain. But as models get lighter and latency requirements tighten, inference migrates to the device itself. Real-time translation on your phone. Autonomous driving decisions. Industrial robotics. Edge AI inference stocks are where the volume story compounds.
Every smartphone is an ARM chip. Every automotive SoC is ARM. IoT devices, industrial controllers, AR headsets — ARM architecture runs them. The edge is already ARM territory. AI moving to the edge means more compute cycles per device, more value per chip, and ARM AI licensing revenue expanding without needing new customers.
Compare that to the Nvidia trade. Nvidia's exposure concentrates in data center GPU clusters. ARM's is dispersed across billions of endpoints. One bad capex quarter from a hyperscaler doesn't dent ARM's royalty stream the way it pressures a single-customer GPU business. MTSI showed how chip outliers can decouple from sector weakness — ARM's model is the cleaner version of that thesis.
ARM Holdings Stock 2026: Is It a Good Buy?
The tape is constructive. ARM closed at 275.60, above both the 50-day moving average at 261.10 and the 200-day at 207.30. Bullish trend structure. Price is extended above long-term support, with the 50-day acting as the key near-term reference should momentum stall.
The 52-week range tells the real story: 100.00 to 452.70. ARM sits 39.1% below its 52-week high and 175.6% above the low. That is not a broken stock. That is a stock that had a violent reset from peak euphoria and is now rebuilding participation from a credible base. Support established around 219.40 over the last 45 sessions. Resistance clusters near 299.30. The current print at 275.60 puts price squarely in the middle of that range, with room in either direction.
Today's volume matters. Seven million shares against a 3.9 million 20-day average indicates real institutional participation, not a low-liquidity drift. The prior five sessions added 4.1% net. Buyers have been methodical, not panicked-in. Higher lows off the 219.40 base suggest accumulation rather than a dead-cat scenario.
ARM Holdings vs Nvidia is actually the wrong comparison. ARM doesn't compete with Nvidia. It collects royalties from Nvidia. The competitive risk that deserves watch-list attention is RISC-V, the open-source alternative architecture some hyperscalers are exploring. Real threat, long timeline, meaningful switching costs. Not today's trade.
What Is a Bull Call Spread and How Do I Use It on ARM Stock?
A bull call spread is a defined-risk options strategy. You buy a call at a lower strike and sell a call at a higher strike, same expiration. The premium collected from the short call offsets the cost of the long call. Maximum gain is capped at the spread width. Maximum loss is capped at the net premium paid. You know both numbers before you put the trade on.
On ARM, the logic is straightforward. If price continues from 275.60 toward the 299.30 resistance zone before expiration, a bull call spread captures that move while keeping loss strictly bounded. You are not betting on a moonshot. You are betting that buyers continue the work already visible in today's tape and price tests the upper end of the near-term range.
The structure is particularly useful when implied volatility is elevated around earnings. Buying a single call outright when options are expensive is a tough game — you can be right on direction and still lose if volatility collapses after the event. Selling the upper strike partially offsets that IV crush. The spread width to choose depends on conviction and time frame. A 280/295 spread costs less but gives the stock less room. A 275/300 spread captures more of the potential move but requires more premium. Neither is advice. Both are math worth doing before the next report. Screen and chart ARM live on Traderise to pull up the options chain and see where implied volatility is currently priced across strike ladders.
What to Watch Next
The 299.30 level is the number. That is where sellers have been active over the last 45 sessions — a clean, defined resistance point. A sustained close above 299.30 on volume would indicate that the current buyers have absorbed overhead supply. A failure there, particularly coinciding with a post-earnings volatility flush, brings the 261.10 50-day back into focus as the level where intermediate-trend buyers typically re-engage.
The macro anchor remains AI capex confirmation. Hyperscaler earnings and the TSMC revenue record both point to acceleration in spend. If that spend is real and sustained, ARM's royalty stream is compounding quietly behind it. Edge AI inference is still early innings.
ARM AI licensing revenue doesn't care whether Nvidia wins the data center or whether a new GPU challenger emerges. It earns from both, and from everything in between. Watch the 299.30 close — that is the tell on whether today's institutional volume was the start of a sustained move or a range-bound fade that hands the tape back to sellers.