Corn and Wheat Prices 2026: The Rally Retail Investors Are Missing
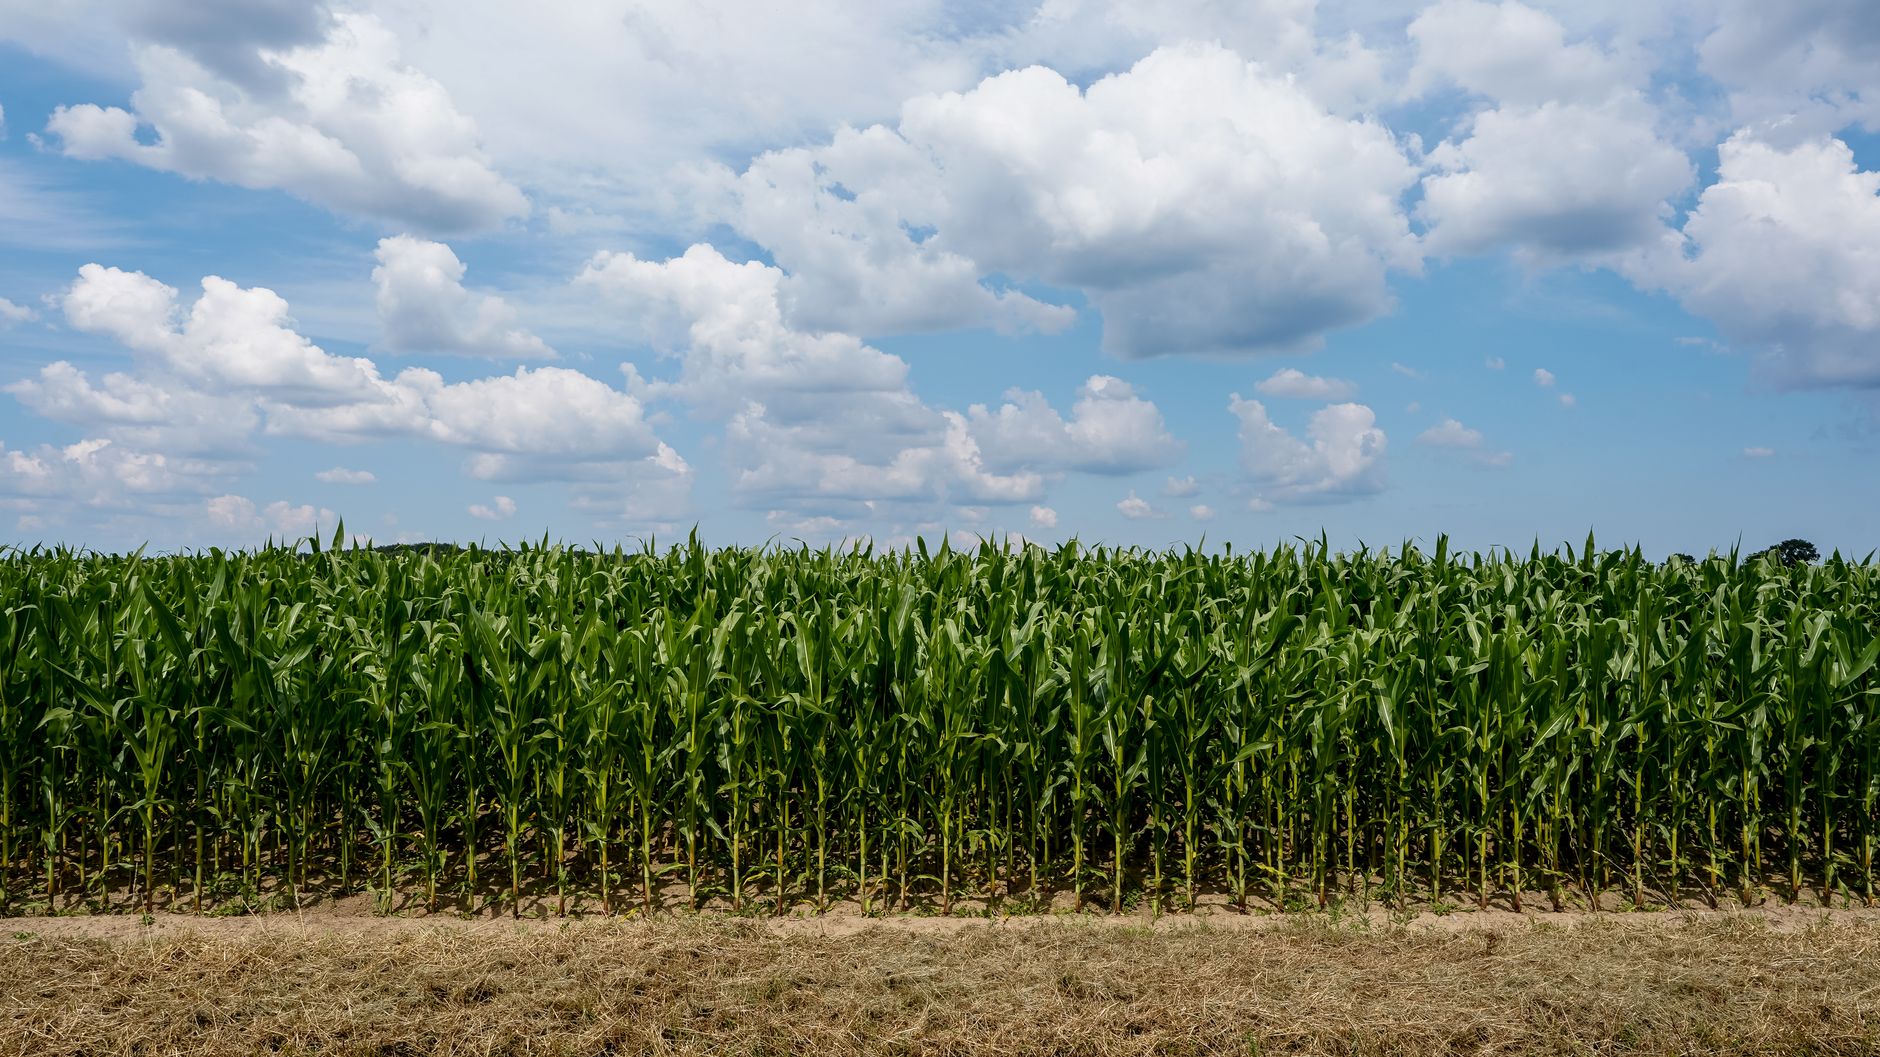
Corn and wheat prices 2026 hit 3-year highs. Learn how to trade CORN ETF, WEAT ETF, DBA, ADM, Bunge, and Mosaic in the grain rally.
Corn and Wheat Prices 2026: What's Driving This Move
Corn and wheat prices 2026 is now a phrase worth writing down. Both markets cleared multi-year highs this week — simultaneously — at levels not seen since early 2023. That kind of joint breakout is not noise. It reflects compounding supply pressure that has been building quietly for months, and it tends to pull in momentum capital fast once the screens light up.
The last time grains ran to these levels, the rally had legs for several months before exhausting itself. That precedent does not guarantee a repeat, but it tells you the market's memory is long enough to sustain a position — which changes how you should think about sizing.
Why Are Corn and Wheat Prices Rising in 2026?
The supply picture starts in the Southern Hemisphere. Erratic rainfall across key South American growing regions clipped production estimates through the back half of 2025, creating a base deficit heading into the current crop year. Not a catastrophic shortfall — tight enough to leave no buffer against additional stress.
The macro layer adds weight. This week's data showed U.S. productivity slowing in Q4 while unit labor costs accelerated. For commodity traders, that combination is a yellow flag: slower output, higher input costs, and an inflation profile that keeps the Fed cautious. Sticky inflation does not kill grain prices — historically, it reinforces them, because the same cost pressures rippling through labor markets also drive food-price components higher.
There is also a currency angle. A less aggressive Fed path limits dollar strength, and dollar softness historically supports commodities priced in USD. None of these drivers is speculative. They are in the data that printed this week.
What ETFs Give Retail Investors Exposure to Corn and Wheat Prices?
For retail participants, the most direct routes are the Teucrium single-commodity funds: the CORN ETF and WEAT ETF. Each tracks a blend of three futures contracts — near-month, the following listed contract, and a longer-dated December — which reduces roll-cost drag compared with straight front-month exposure. They are imperfect instruments. They are also clean, liquid, and available in any standard brokerage account.
The broader DBA agricultural ETF offers a diversified basket covering corn and wheat alongside soybeans, sugar, and live cattle. DBA dampens the volatility of a single-crop bet — useful if you want commodity inflation exposure without leaning fully into grains. The tradeoff is that a pure corn-and-wheat rally shows up in DBA only partially; other basket components dilute the move.
If you have been following how the copper trade setup works for commodity momentum, the mechanics here are similar: identify the directional driver, choose the vehicle with the cleanest exposure, then size to the volatility rather than to a price target.
You can track grain and commodity moves live on Traderise charts to monitor futures and ETF pricing together — useful when the gap between spot and ETF widens on high-volume sessions, which is exactly when execution quality matters most.
Is ADM or Bunge Stock a Buy During a Grain Commodity Rally?
Equity plays in this space require a cleaner framework than "grain is up, therefore buy the processor." ADM stock and Bunge BG sit in the grain commodity rally 2026 trade as direct processors, but the relationship between commodity price and processor margin is not linear.
ADM and Bunge earn on crush margins and logistics — the spread between what they pay for raw grain and what end-buyers absorb for processed product. When prices surge quickly, that margin can compress if input costs outrun pricing power. Both companies tend to perform best when prices are elevated and stable, giving them time to reset contracts across the supply chain.
That said, if the grain rally has the sustained multi-month character suggested by the historical precedent, processor margins normalize and then expand as pricing resets downstream. For a position in ADM or BG, time horizon is the critical variable: a two-week trade and a three-month trade carry completely different risk profiles. Know which one you are putting on before you press execute.
The Fertilizer Second Derivative: Mosaic MOS
Mosaic MOS fertilizer stock 2026 is a second-derivative play that often lags the initial grain move by several weeks. The logic is straightforward: higher crop prices incentivize farmers to maximize planted acres and yield, which increases fertilizer demand. Mosaic, as a major potash and phosphate producer, sits directly in that demand path.
The lag can be an advantage for position management. You have time to observe whether the grain rally holds before committing capital to MOS. The risk is that grains reverse before the move translates into fertilizer order books. Size accordingly: if MOS is a secondary bet, it should carry a smaller initial allocation than your primary ETF position — not because the thesis is weaker, but because the causal chain is longer.
How Does Inflation Affect Agricultural Commodity Prices?
This is the mechanism that gives the grain move macro significance beyond crop fundamentals. Agricultural commodities carry substantial labor and energy cost inputs: planting, harvesting, processing, and transport all price off wages and diesel. When unit labor costs accelerate — as they did in the Q4 data released this week — the cost floor under agricultural prices rises. That effect does not reverse quickly; it embeds into the price structure of the next growing season.
The parallel to energy markets is direct. The diesel crack spread playbook for commodity inflation trades captures how input costs ripple through commodity sectors. Grain follows a similar path: energy and labor inflation feeds into production cost structures, and those costs stay sticky.
For the Fed, a sustained grain move — already visible in food components of CPI — complicates the path to rate cuts. That dynamic is not fully priced into equity markets, which makes the grain trade both a standalone commodity position and a meaningful macro hedge against inflation re-ignition.
Sizing the Trade Around Seasonal Volatility
Grain markets carry seasonal volatility patterns that any participant should internalize before sizing up. The spring planting window and the summer growing season produce the highest daily price swings of the year. A position sized for calm January conditions can feel extreme by late May.
A practical starting point: determine a notional allocation that assumes a 20% adverse move in your primary ETF position. If that scenario does not cause material portfolio damage, the size is defensible. Scale into the equity plays — ADM, BG, MOS — only after the ETF position is established and showing early confirmation from price and volume.
The process discipline matters as much as the thesis. A well-constructed grain trade with tight initial sizing can be added to as the move develops. A full position entered on day one of a breakout leaves no room to manage if the initial push reverses. Enter small, give the trade room to breathe, and let the market confirm before you press.